How to send your syslog message to InfluxDB with Telegraf
InfluxDB not only support metrics, it also can store your syslog. I have played around with metrics, now I’d like to send my log to InfluxDB. Here is how I did.
1. Turn your telegraph as a syslog server listener. I chose to use UDP instead of TCP. 6514 is the UDP port
 [[inputs.syslog]]
#   ## Specify an ip or hostname with port - eg., tcp://localhost:6514, tcp://10.0.0.1:6514
#   ## Protocol, address and port to host the syslog receiver.
#   ## If no host is specified, then localhost is used.
#   ## If no port is specified, 6514 is used (RFC5425#section-4.1).
   server = "udp://:6514"
systemctl restart telegraf2. On the client side, We need to tell rsyslog to send the log to my Telegraf. Check the config below, you need to specify RSYSLOG_SyslogProtocol23Format. , “@” is for UDP , “@@” is for TCP
#  /etc/rsyslog.conf    Configuration file for rsyslog.
#
#                       For more information see
#                       /usr/share/doc/rsyslog-doc/html/rsyslog_conf.html
#
#  Default logging rules can be found in /etc/rsyslog.d/50-default.conf

*.* @mytelegraf.server.com:6514;RSYSLOG_SyslogProtocol23Format

#################
#### MODULES ####
#################
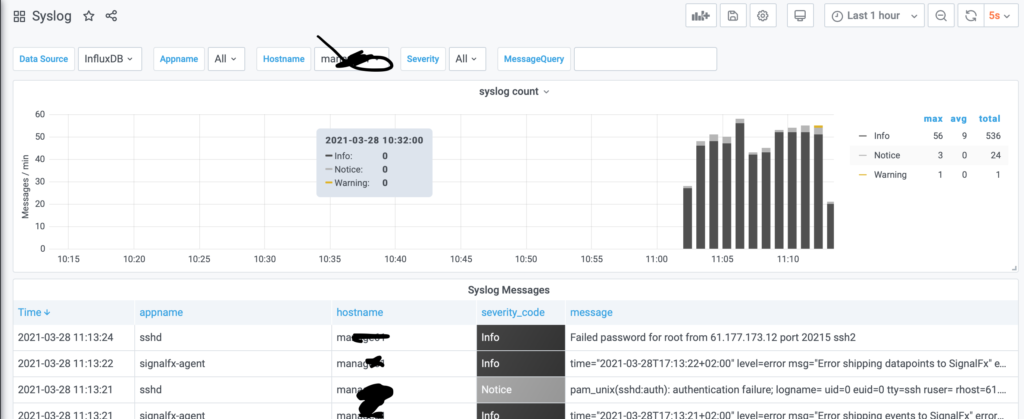
systemctl restart rsyslogThe next step is to download a Syslog dashboard from Grafana and see how it works