SignalFX – Jaeger -HotRod
Just imagine, you have an application that is using Jaeger as the backend, but now you want to switch to SignalFX. This is do able. Below is the steps
- Install SignalFX Agent:
SignalFX Agent is used to collect your host info such as memory and cpu,network … it uses collectd for this purpose. Signalfx Agent also can act as a collector for Jaeger client via GRPC. Installing Signalfx Agent is not difficult, follow their current instruction from your account. To make it easy for you i will share my configuration
---
# *Required* The access token for the org that you wish to send metrics to.
signalFxAccessToken: {"#from": "/etc/signalfx/token"}
ingestUrl: {"#from": "/etc/signalfx/ingest_url", default: "https://ingest.signalfx.com"}
apiUrl: {"#from": "/etc/signalfx/api_url", default: "https://api.signalfx.com"}
cluster: {"#from": "/etc/signalfx/cluster", optional: true}

intervalSeconds: 10

logging:
  # Valid values are 'debug', 'info', 'warning', and 'error'
  level: info

# observers are what discover running services in the environment
observers:
  - type: host

monitors:
  - {"#from": "/etc/signalfx/monitors/*.yaml", flatten: true, optional: true}
  - type: host-metadata
  - type: processlist
  - type: cpu
  - type: filesystems
  - type: disk-io
  - type: net-io
  - type: load
  - type: memory
  - type: vmem
  - type: jaeger-grpc
  - type: signalfx-forwarder

    listenAddress: 127.0.0.1:9080
    extraSpanTags:

      environment: WBPetClinic

traceEndpointUrl: "https://ingest.us1.signalfx.com/v2/trace"


collectd:

  disableCollectd: true

  configDir: /tmp/collectd


writer:

  traceExportFormat: sapm
The important line is “- type: jaeger-grpc” this line will turn smartagent as a collector, it will listen on port 14250 , after making the configuration change , run service signalfx-agent restart , and run “signalfx-agent status” to check its status.
The next step is to run Jaeger Agent and point the collector to SmartAgent. In the example , 10.0.2.15 is my SmartAgent IP
docker run -d -p5775:5775/udp -p6831:6831/udp -p6832:6832/udp -p5778:5778/tcp jaegertracing/jaeger-agent:latest --reporter.grpc.host-port=10.0.2.15:14250The fun part is coming, it’s time to run HotRod , again 10.0.2.15 is my JaegerAgent – the reason my IP 10.0.2.15 is because i run it in the docker, we can’t use localhost
docker run \
  --rm \
  --env JAEGER_AGENT_HOST=10.0.2.15 \
  --env JAEGER_AGENT_PORT=6831 \
  -p8080-8083:8080-8083 \
  jaegertracing/example-hotrod:latest \
  all
So, let try to see if we can see our HotRod : http://localhost:8080
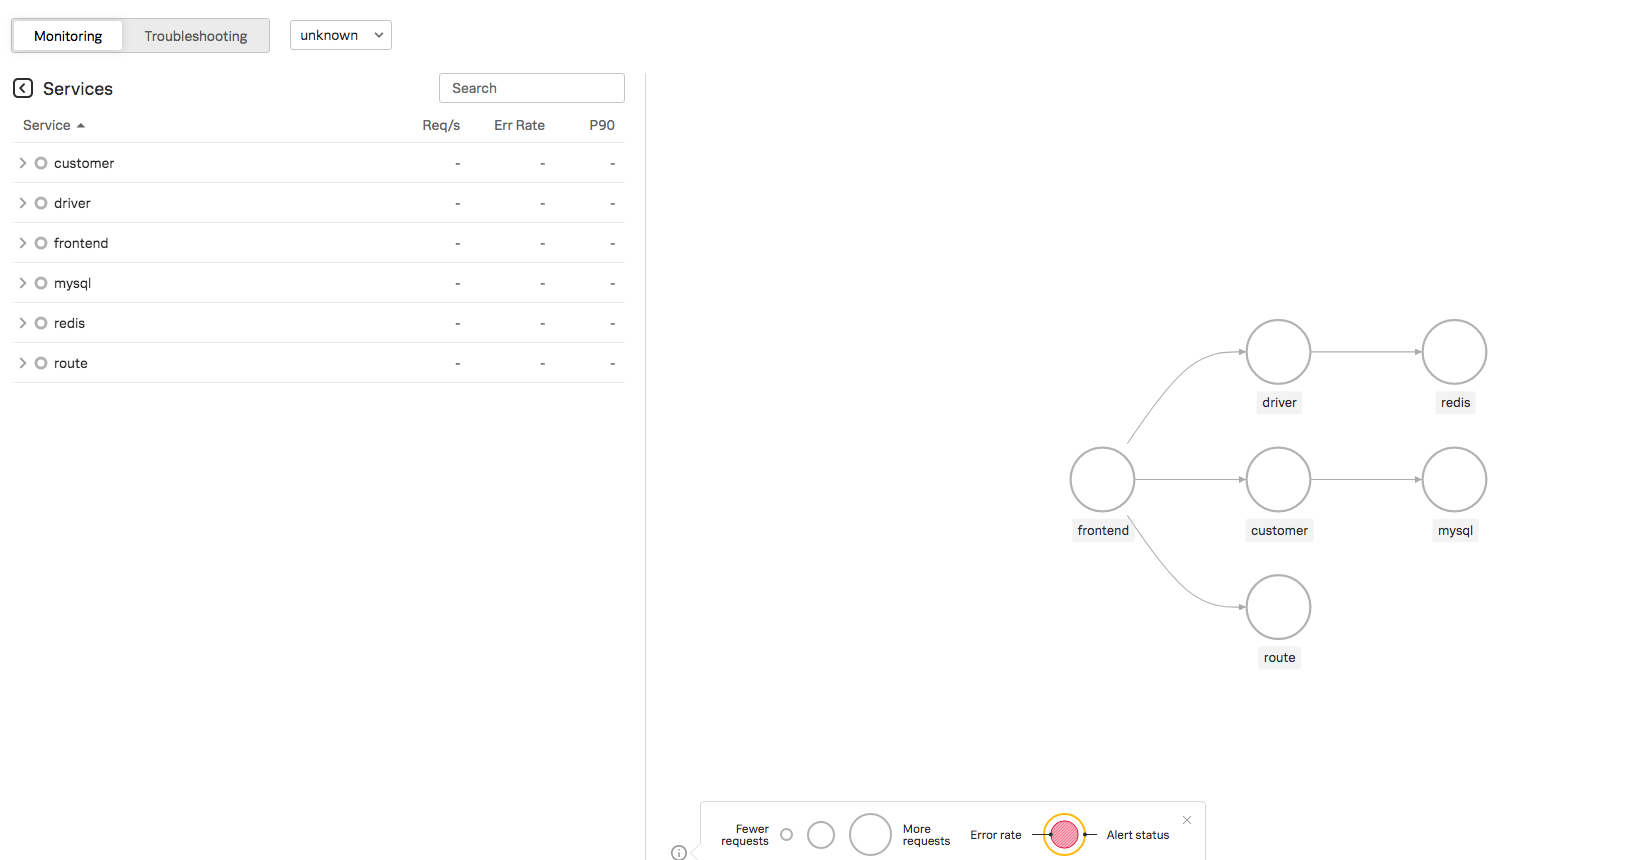
Wait for a while, then you will see the data reporting in SignalFX